First False Argument:
The first way this is a false argument is that climate science is not about modeling. Models, in the modern sense of the word, are mathematical representations of something to help us understand things. In the case of climate models, they help us to understand an extremely complex system involving a multitude of different processes. But, those processes will continue to do what they want with, or without, the models.
Nature is what it is and is not sitting around waiting for a model to tell it what to do!
If is it raining outside and I have a model that predicts rainfall, is the actual rain outside going to change depending on what my model says? No! Of course, not! Then, why in the world would you think that the study of possibly the most complex process on the entire planet is all about a model?
We have many tools and models are important ones. But, they are not the only tools we use. There are satellites, sonobuoys, various kinds of thermometers, ice cores, sea floor cores, lacustrine cores, coral cores, weather balloons, tree rings and many more tools. The science is not dependent on just one of them.
Climate science is the study of all of these processes involved in making our climate. But, the climate will do what it does, and our study or understanding of that doesn't change the reality. Global warming is all about the real world stuff going on with our planet's climate. It is not about models or papers or discussions at a conference. Those are things we do in the study of the science. Global warming is the reality of nature independent of anything we do or say.
Second False Argument
The second way the argument is false is that it is assumed that if the models are not 'accurate' (without any definition of what that means), then the models are invalid and climate science is invalid. This is so preposterous that it truly shows the mindset of anyone saying it, and that mindset is a desperate attempt to reject science.
What about weather models? Is meteorology invalid because weather models are not accurate? Do you ever bother to check the weather forecast? Do you check to see if you need to take an umbrella with you today? Do you check to see if its going to be cold or hot? Do you go to the supermarket and get some food when they say a big snowstorm is coming in? Have you ever made a single decision based on the weather forecast?
Why?
Weather forecasts come from meteorology models and we all know that the weather forecast is not very accurate. Does that mean meteorology is fake? Does that mean there are a bunch of meteorologists promoting a false science in order to keep their government grants coming? Does that mean there are a bunch of people that have deluded themselves and are following meteorologists like sheep? Of course, not!
So, if this line of reasoning is false with regard to meteorology and weather models, why is it valid for climate science and climate models?
Third False Argument
I have had people actually pull out model results from 20, even 30 years ago and point to them as evidence that man made global warming isn't real. First, review the first and second false arguments above to see why this is not even a valid argument to begin with. But, this is its own brand of false argument all by itself.
Let's go back to the weather forecast. Which would you rather have, the weather forecasting of today, or the weather forecasting of 1980? What's that you said? You said you would prefer the weather forecasting of today?
Why?
Could it be that you recognize that there have been advances in the weather modeling over the last 30 years? That meteorologists have tools and data bases they didn't have 30 years ago? That the science of meteorology has advanced and we understand the weather better today than we did 30 years ago? Those would all be correct conclusions and, yes, the weather models of today are much better than the models of 1980, along with the forecasts we get from them.
Then, why would anyone suppose the climate science models would be any different? Why would anyone suppose that the climate models of 2014 are not any better than the climate models of 1980, or 1990, or even 2000? The science is advancing. We are getting new tools and the data base is growing. Our understanding of the science is improving. Just as with the meteorology models, the climate models are getting better all the time.
The fact that models improve with time does not invalidate models, it serves as validation. It shows we are increasing our understanding and that we are making progress. And, it certainly, in no way, is any kind of evidence that AGW is not real.
Fourth False Argument
The fourth false argument centers around the conclusion that a climate model that does not give an accurate forecast on the global average temperature is 'wrong.' This is not the case. There are many different models and they do different things. Read this statement from the IPCC AR5 report on modeling:
The models used in climate research range from simple energy balance models to complex Earth System Models (ESMs) requiring state of the art high-performance computing. The choice of model depends directly on the scientific question being addressed (Held, 2005; Collins et al., 2006d). Applications include simulating palaeo or historical climate, sensitivity and process studies for attribution and physical understanding, predicting near-term climate variability and change on seasonal to decadal time scales, making projections of future climate change over the coming century or more and downscaling such projections to provide more detail at the regional and local scale. Computational cost is a factor in all of these, and so simplified models (with reduced complexity or spatial resolution) can be used when larger ensembles or longer integrations are required. Examples include exploration of parameter sensitivity or simulations of climate change on the millennial or longer time scale. Here, we provide a brief overview of the climate models evaluated in this chapter.
IPCC AR5, Chapter 9 - Evaluation of Models
As you can see, there are lots of different kinds of models and you can't evaluate them all the same way.
Besides, a model that gives a result that does not conform with observed results can still be very valuable. Models are built on our understanding of physics. If we understand the situation correctly, then they should reflect the reality. When they don't reflect reality as well as we would like that tells us there is something we are missing. This can be extremely valuable.
The important point to remember is that there are lots of different models and they do lots of different things. You cannot judge all of them by the same standard.
I will have more to say on that topic below.
Fifth False Argument
The fifth way this is a false argument is that contrarians and deniers criticize the models and cite them as proof that we shouldn't do anything about global warming, but don't develop any models of their own to support their claims.
Why is that? Why is it the people criticizing models can't produce any models to support their claims? The only thing they can do is criticize, but they can't produce anything of their own. If, as they claim, you can get models to do anything, why have they not done so? Where is the Heartland Institute's model? Where is Craig Idzo's model? Where is Richard Lindzen's model?
Mr. Roy Spencer has, in fact, produced a model he claims shows global warming is nothing more than a naturally occurring event. Unfortunately, the only way Mr. Spencer could get it to work is to use false inputs. The results are very different when real data is used. Here is a nice review of his work that really shows how he keeps manipulating things until he gets the desired result.
So, why don't we see forecasts from denier models that accurately forecast the climate?
And, more importantly, why have they avoided this question? What are they trying to hide from the public?
The answer is tragically simple - Because they can't!
It is easy to sit there and say the models are no good when you can't do it yourself. The last thing any denier ever wants to do is to try and develop a model that ends up giving results counter to their claims. That really would be a case of Frankenstein's monster. The denier model that turned on its creator.
So, the next time you here some contrarian or denier going on about climate models, ask them one question - Where are the alternative models that support the contrarian claims? Be prepared for the silence.
Sixth False Argument
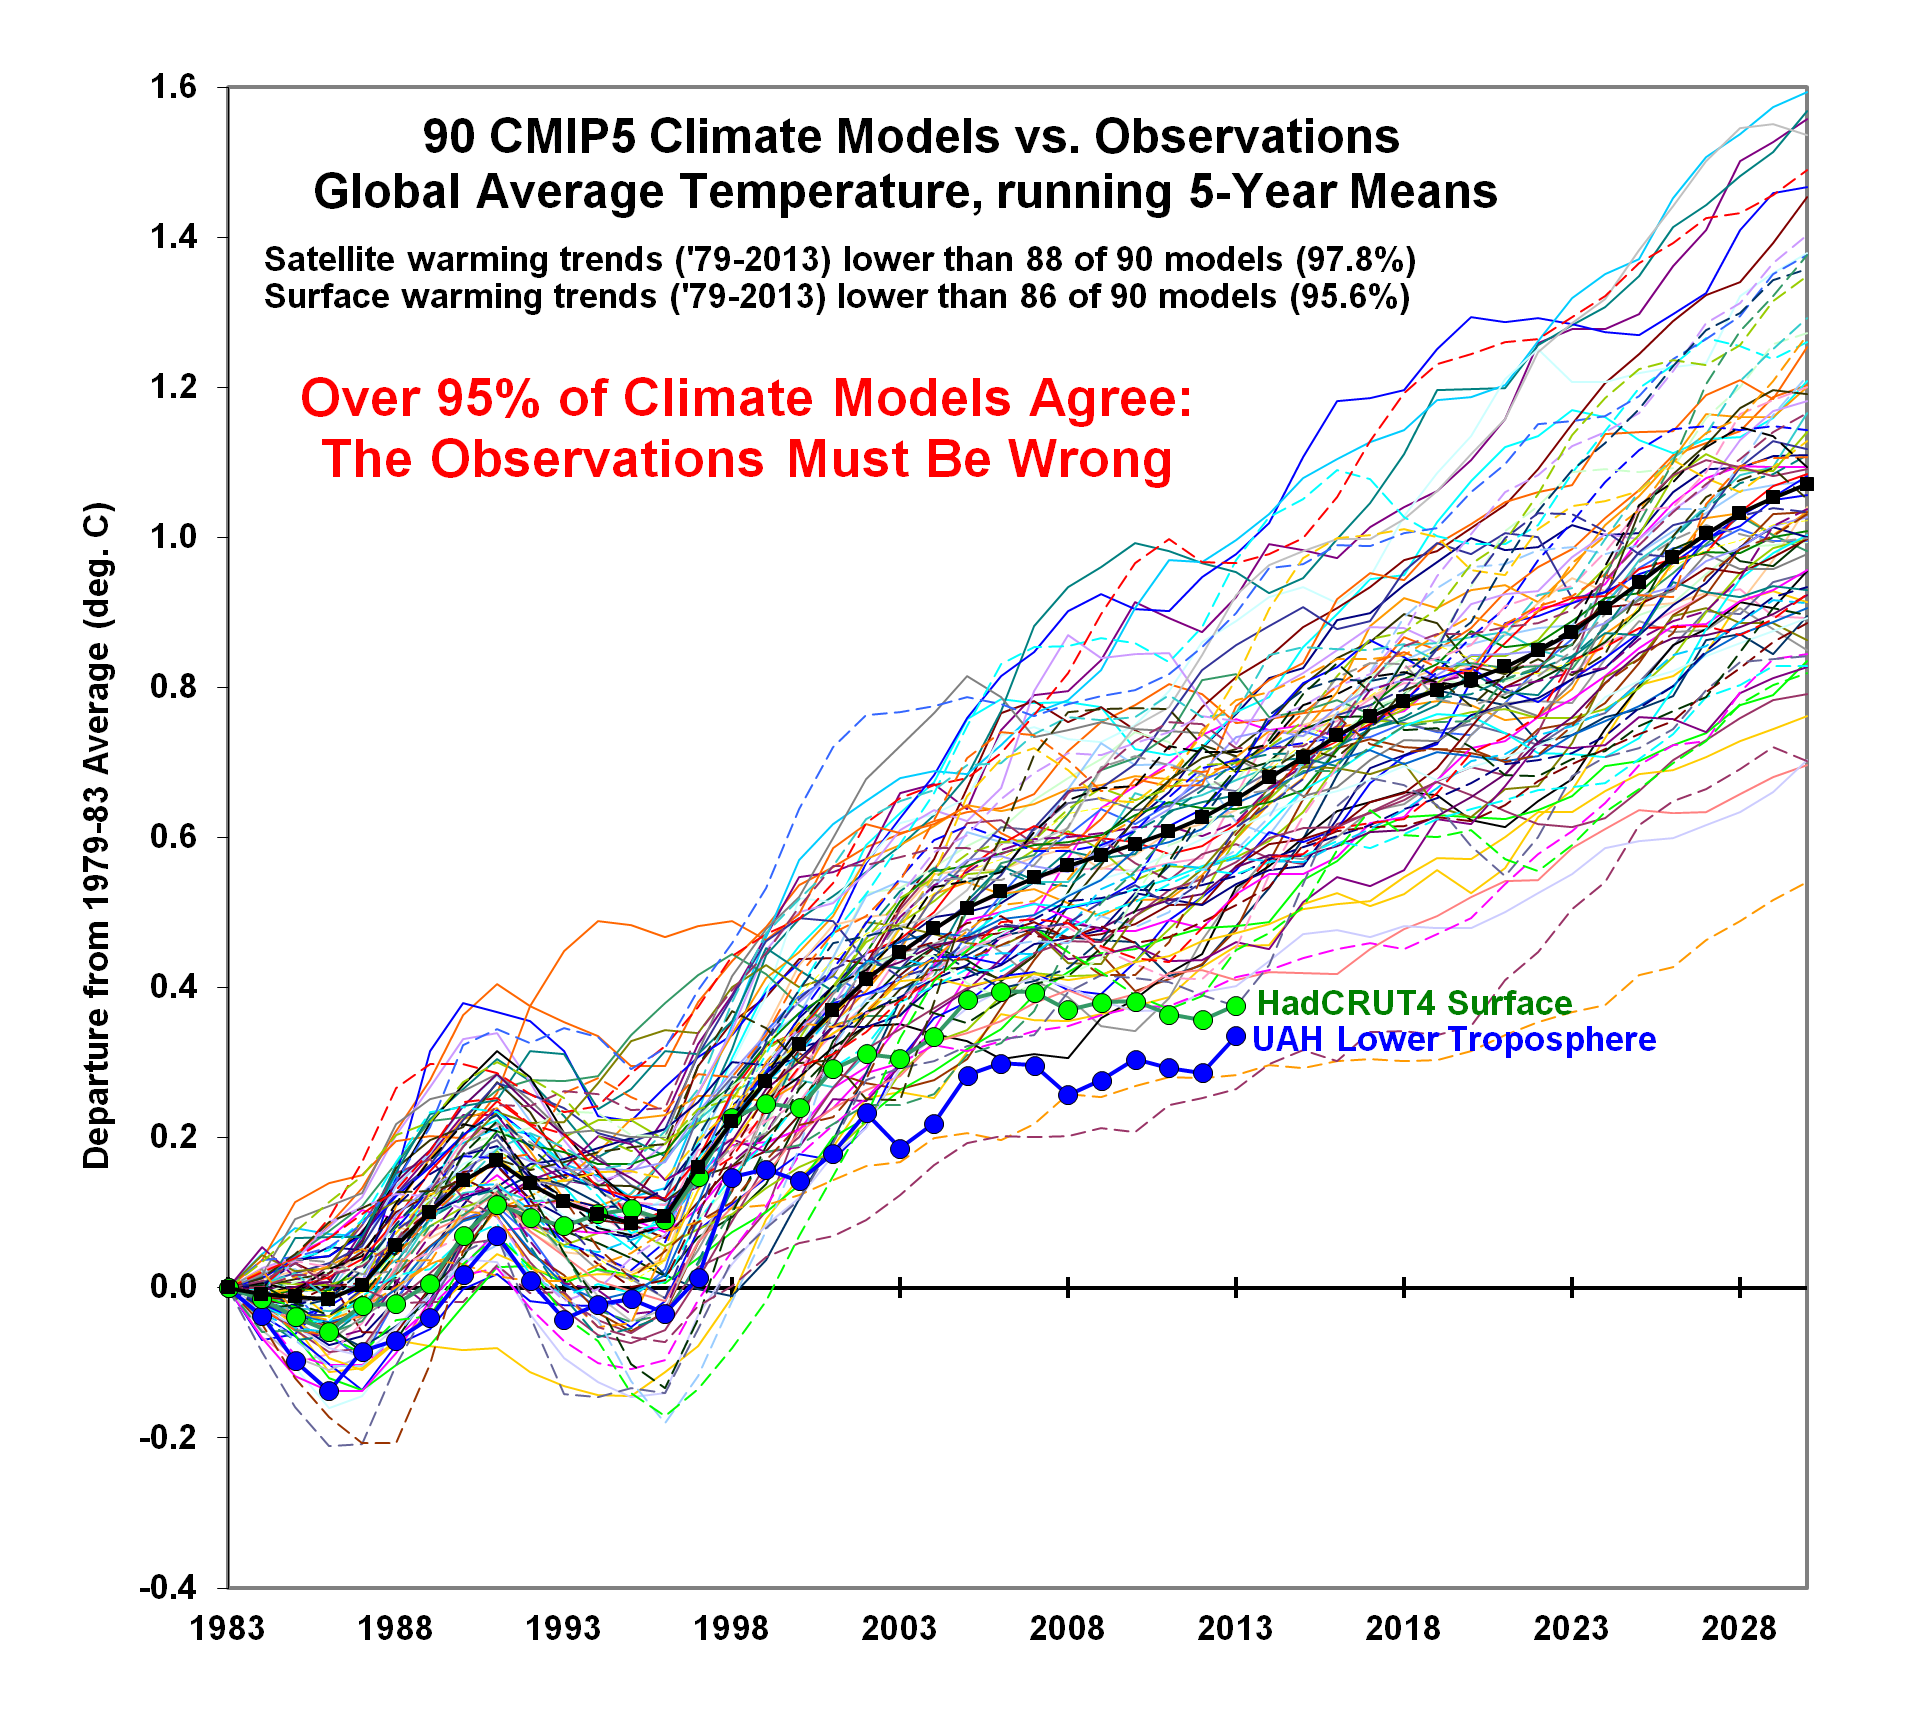
The sixth way this is a false argument is because contrarians and deniers are actually lying about model errors. How many times have you seen this plot? It even states right on the graphic, "Over 95% of Climate Models Agree: The Observations Must be Wrong"
 |
| Source: The Federalist |
You may play with the climate model outputs for yourself at this site here.
One particular contrarian site states, "Unfortunately, climate models — ones that can accurately and consistently predict global temperatures in the not-so-distant future — simply don’t exist in the present." The message is certainly being spread. But, is it a valid message? Let's check into this plot and find out.
I had a serious question about this plot the moment I saw it - the IPCC data page only lists 59 models but this plot has results from 90 models, so where did these other 31 models plotted here come from? It is true that there might be other models that are not listed on the IPCC page, but why doesn't this graphic list them or give a link to a list of them? This made me curious about this plot. Where did it come from and what are these plots it shows? Ultimately, I have to wonder if it was falsified. It would not be the first time denier organizations promulgated false statements.
And, you know what I found? It was falsified!
To no surprise, I found the chart originated with Roy Spencer, a denier with a record of falsifying his research. His original chart can be found here. In his posting he states he plotted the results of 90 climate models, but I cannot find a list of those models anywhere. But, analysis of the plot has shown he falsified the data by misaligning it. And, the evidence indicates it was done deliberately.
This is how Mr. Spencer falsified the graph. The data is plotted versus some baseline. Normally, we use a baseline based on some average to smooth out the large amount of variability observed from year to year. Picking a large number of years as the baseline average prevents one weird year from skewing the average. Using a small number of years allows one particular year to throw off the data. We normally use a 30-year average. Mr. Spencer used a 5-year average. Why would he do that when he is well-versed in this methodology? And, why did he use the particular baseline he selected: 1979 - 1983? Well, one result of using a five-year average based on the 1979-1983 period is that it resulted in a misalignment of the data. You can read the analysis here.
Here is what happens when the alignment is done incorrectly and then redone correctly:
 |
| Source: HotWhopper |
Quite a change. And, isn't it amazing that the selection of the five-year baseline served to support the claims of the denier organizations?
But, there is still more problems with Mr. Spencer's work. Take a look at his original plot of the 90 models above and you can see the UAH data (the blue line) is consistently significantly lower than the HadCRUT4 data (the green line). But, look at the plot just above this paragraph graphing both of these data sets. The UAH data is not consistently higher, the reality is they are actually very close, especially when aligned using a proper baseline. One more indication that Mr. Spencer deliberately falsified the graph.
This plot here shows the two temperature plots the same as above, but adds the results of the CMIP5 model. The first shows the results of Mr. Spencer's improper alignment, while the second shows what happens when you use a proper alignment. The difference is pretty dramatic. Clearly, the model results are MUCH better than Mr. Spencer would like you to believe.
 |
| Source: HotWhopper |
It is amazing to see how many mistakes this guy makes and how each and every one of those mistakes works to confirm his desired conclusion. You would think, by the law of averages, that at least some of those errors would work against his desired conclusion. This all leads me to the conclusion that Mr. Spencer intentionally and deliberately falsified this plot in order to undermine climate science and support the conclusion he wants.
Ultimately, the question has to be, why is Mr. Spencer falsifying his results? If the science really supported what he claimed, it would not be necessary to falsify his data. There can be one, and only one, answer to this question - Spencer has a desired outcome that is not supported by science, so he will do whatever is necessary to obtain that conclusion with his work rather than change his beliefs.
And, that is the penultimate definition of a denier.
If the models are as wrong as the deniers claim, why do they have to lie about them?
Seventh False Argument:
The seventh way this is a false argument is that the models are actually much more accurate than contrarians would like you to know. As we have seen, when someone tells you the models have all failed they are selling you a bad bill of goods. But, the accuracy of the models is really the heart of the whole issue, isn't it? We know the deniers are lying about the inaccuracies, but just how accurate are they?Take a look at this plot of the AR4 models and the actual recorded data. The models look pretty good to me.
 |
| Source: Open Mind |
To no surprise, there is plenty of literature out there on this subject. Some of it in the form of refereed papers in scientific journals, some of it in more popular forms. I'll be using both. Let's start with some of the scientific papers because they make some points that I want to use later. The link to the paper is provided as well as each paper's abstract.
Performance metrics for climate models, by P. J. Gleckler, K. E. Taylor and C. Doutriaux, published in the Journal of Geophysical Research - Atmospheres, Volume 113, Issue D6, 27 March 2008
Abstract
[1] Objective measures of climate model performance are proposed and used to assess simulations of the 20th century, which are available from the Coupled Model Intercomparison Project (CMIP3) archive. The primary focus of this analysis is on the climatology of atmospheric fields. For each variable considered, the models are ranked according to a measure of relative error. Based on an average of the relative errors over all fields considered, some models appear to perform substantially better than others. Forming a single index of model performance, however, can be misleading in that it hides a more complex picture of the relative merits of different models. This is demonstrated by examining individual variables and showing that the relative ranking of models varies considerably from one variable to the next. A remarkable exception to this finding is that the so-called “mean model” consistently outperforms all other models in nearly every respect. The usefulness, limitations and robustness of the metrics defined here are evaluated 1) by examining whether the information provided by each metric is correlated in any way with the others, and 2) by determining how sensitive the metrics are to such factors as observational uncertainty, spatial scale, and the domain considered (e.g., tropics versus extra-tropics). An index that gauges the fidelity of model variability on interannual time-scales is found to be only weakly correlated with an index of the mean climate performance. This illustrates the importance of evaluating a broad spectrum of climate processes and phenomena since accurate simulation of one aspect of climate does not guarantee accurate representation of other aspects. Once a broad suite of metrics has been developed to characterize model performance it may become possible to identify optimal subsets for various applications.
What they are saying:
This paper was published in 2008, so it is examining the CMIP3 (Coupled Model Intercomparison Project 3. A coupled model is one that combines more than one model to get a single result), instead of the newer CMIP5, but it is still a valid paper. What they are doing is trying to examine the forecasts of the model to see how accurate it is. This is much more difficult with climate models than with weather models. With a weather model you are getting a solid feedback every single day. It takes a lot longer to get performance feedback with climate models. And, what does that feedback mean? How do you evaluate it.
So, they came up with a grading system for a number of different variables and they graded the models accordingly. They made a very interesting statement:
"Forming a single index of model performance, however, can be misleading in that it hides a more complex picture of the relative merits of different models."
This is consistent with what I said above under Fourth False Argument.
Note this statement from the paper:
Although the value of climate model metrics has been recognized for some time [e.g., Williamson, 1995], there are reasons why climate modelers have yet to follow the lead of the NWP community. First, a limited set of observables (e.g., surface pressure anomalies) have proven to be reliable proxies for assessing overall NWP forecast skill, whereas for climate models, examination of a small set of variables may not be sufficient. Because climate models are utilized for such a broad range of research purposes, it seems likely that a more comprehensive evaluation will be required to characterize a host of variables and phenomena on diurnal, intraseasonal, annual, and longer times scales. To date, a succinct set of measures that assess what is important to climate has yet to be identified.Later, they state,
"We note that even the “better” models score below average in the simulation of some fields, while the “poorer” models score above average in some respects (especially in the tropics)"
The overall conclusion is that it is not easy to evaluate models, and they state,
"Finally, in spite of the increasing use of metrics in the evaluation of models, it is not yet possible to answer the question often posed to climate modelers: “What is the best model?” The answer almost certainly will depend on the intended application."
But, if it is so difficult, how is it possible for the deniers to conclusively say they all fail? Where are the evaluation metrics they use to reach that conclusion? That should be a gigantic red flag for anyone listening the denier claims about climate models - scientists have difficulty coming up with evaluations of models, but contrarians don't. Hmmm.
Let's try another paper.
How reliable are climate models?, by JOUNI RÄISÄNEN in Tellus A, Volume 59, Issue 1, pages 2–29, January 2007
ABSTRACT
How much can we trust model-based projections of future anthropogenic climate change? This review attempts to give an overview of this important but difficult topic by using three main lines of evidence: the skill of models in simulating present-day climate, intermodel agreement on future climate changes, and the ability of models to simulate climate changes that have already occurred. A comparison of simulated and observed present-day climates shows good agreement for many basic variables, particularly at large horizontal scales, and a tendency for biases to vary in sign between different models, but there is a risk that these features might be partly a result of tuning. Overall, the connection between model skill in simulating present-day climate and the skill in simulating future climate changes is poorly known. An intercomparison of future climate changes between models shows a better agreement for changes in temperature than that for precipitation and sea level pressure, but some aspects of change in the latter two variables are also quite consistent between models. A comparison of simulations with observed climate changes is, in principle, a good test for the models, but there are several complications. Nonetheless, models have skilfully simulated many large-scale aspects of observed climate changes, including but not limited to the evolution of the global mean surface air temperature in the 20th century. Furthermore, although there is no detailed agreement between the simulated and observed geographical patterns of change, the grid box scale temperature, precipitation and pressure changes observed during the past half-century generally fall within the range of model results. Considering the difficulties associated with other sources of information, the variation of climate changes between different models is probably the most meaningful measure of uncertainty that is presently available. In general, however, this measure is more likely to underestimate than overestimate the actual uncertainty.
What he is saying:
This one is similar to the previous one we looked at in that it tries to find a way to evaluate models. The thing I found pertinent about this paper was the effort to evaluate models based on, among other things, the ability to simulate climate change that has already occurred. What that means is to go back in the data and use it to model the climate at a later date that has already occurred so we can compare the model results to the reality. The author states,
And,
BTW, if you want to obtain some background knowledge on how models are built and operate, this paper goes into quite a bit of detail on the subject.
This one is similar to the previous one we looked at in that it tries to find a way to evaluate models. The thing I found pertinent about this paper was the effort to evaluate models based on, among other things, the ability to simulate climate change that has already occurred. What that means is to go back in the data and use it to model the climate at a later date that has already occurred so we can compare the model results to the reality. The author states,
A comparison of simulated and observed present-day climates shows good agreement for many basic variables, particularly at large horizontal scales, and a tendency for biases to vary in sign between different models, but there is a risk that these features might be partly a result of tuning.And,
Nonetheless, models have skilfully simulated many large-scale aspects of observed climate changes, including but not limited to the evolution of the global mean surface air temperature in the 20th century.But, he still reaches the conclusion,
Overall, the connection between model skill in simulating present-day climate and the skill in simulating future climate changes is poorly known.In other words, what he sees is pretty good, but he could not determine if that means it will be accurate going into the future.
And,
...the reliability of long-term climate change projections is much harder to estimate than that of weather forecasts. The latter can be quickly verified against the weather evolution that actually happened and, although the accuracy of the forecasts varies from time to time, their typical quality can be quantified by collecting verification statistics over a sufficient number of cases. For climate change projections, this approach is not practical, particularly as there are no earlier well-observed analogies of the type of primarily greenhouse-gas-induced climate change that is expected in the future. The reliability of these projections can therefore only be estimated by indirect methods.In his conclusion, he states,
Although there are many reasons to believe that climate models can give useful information on future climate, the question on model reliability has no simple quantitative answer. Below, I first list some key arguments that suggest that models do give reliable projections of climate change or, at least, that the uncertainty is reasonably well captured by the variation between different models:We can see a trend is developing - It is difficult to evaluate models, but they do well when the effort is made.
- 1. Models are built on well-known physical principles. Despite the approximations needed in the description of some processes, this gives a priori reason to expect that models should be able to provide useful information on climate changes.
- 2. Many large-scale aspects of present-day climate are simulated quite well by the models. In addition, biases in the simulated climate tend to be unsystematic, so that observational estimates of present-day climate fall within the variation of model results.
- 3. When compared with each other, different climate models agree qualitatively or semi-quantitatively on several aspects of climate change. Moreover, many large-scale aspects of simulated greenhouse-gas-induced climate change are understood well in physical terms – one example of this is the general increase in high-latitude precipitation allowed by a larger moisture transport capacity of a warmer atmosphere.
- 4. Models have successfully simulated several large-scale aspects of climate change observed during the instrumental period. Although there is no detailed agreement between observed and simulated changes on smaller horizontal scales, this is largely as expected from the internal variability in the climate system. In most parts of the world, the temperature, precipitation and pressure changes observed during the past half-century fall within the range of model-simulated changes. Exceptions do occur, but not much more frequently than would be expected in the case that the simulated and observed changes belonged to the same statistical population.
- 5.Observation-based estimates of global climate sensitivity are, although uncertain, consistent with model results.
On the other hand, there are a number of issues that weaken the arguments given above and complicate their interpretation:
- 1. Many small-scale processes that cannot be simulated explicitly in current climate models are important for the feedback effects that regulate the response of climate to changes in external forcing. Cloud processes are the most important example.
- 2. The good agreement between simulated and observed present-day climates, and the tendency of the biases to vary in sign between different models, might arise partly because observations of present-day climate are used in tuning the models.
- 3. Models do not agree on all aspects of future climate change, particularly not on small horizontal scales. Overall, the agreement on changes in precipitation and atmospheric circulation is worse than the agreement on temperature changes.
- 4. A comparison between simulated and observed climate changes is complicated by uncertainty in the forcing factors (particularly the magnitude of aerosol forcing) that have affected 20th century climate. In addition, the climate changes projected for the rest of the 21st century are much larger than those observed this far. The impact of possible common model errors on the simulated climate changes will therefore also be larger for the future than for the past.
- 5. Because of uncertainties associated with forcing, observations and internal climate variability, key properties of the climate system such as the equilibrium climate sensitivity are still difficult to estimate from observations with a useful accuracy. Regional aspects of greenhouse-gas-induced climate change are even more difficult to constrain by observations.
- 6. Although climate models have been run for different emission scenarios, other aspects of forcing uncertainty are not covered well by existing multimodel ensemble simulations of future climate.
BTW, if you want to obtain some background knowledge on how models are built and operate, this paper goes into quite a bit of detail on the subject.
So, we are learning that models aren't nearly as bad as contrarians claim. Nor is it as easy to evaluate them as contrarians claim.
There are lots and lots of papers on climate models and I'm not going to burden you with too many of them, but let's do one more before moving on to other sources of review.
There are lots and lots of papers on climate models and I'm not going to burden you with too many of them, but let's do one more before moving on to other sources of review.
How Well Do Coupled Models Simulate Today's Climate?, by Thomas Reichler and Junsu Kim in the Bulletin of the American Meteorological Society, Volume 89, Issue 3 (March 2008)
AbstractInformation about climate and how it responds to increased greenhouse gas concentrations depends heavily on insight gained from numerical simulations by coupled climate models. The confidence placed in quantitative estimates of the rate and magnitude of future climate change is therefore strongly related to the quality of these models. In this study, we test the realism of several generations of coupled climate models, including those used for the 1995, 2001, and 2007 reports of the Intergovernmental Panel on Climate Change (IPCC). By validating against observations of present climate, we show that the coupled models have been steadily improving over time and that the best models are converging toward a level of accuracy that is similar to observation-based analyses of the atmosphere.
The abstract pretty much says it all - models have been steadily improving and are getting pretty good.
This figure below is an example of how we can use models to help us understand what is going on. The first graph shows model results using only naturally occurring factors with the global average surface temperature data plotted on top. The model forecast is in grey (the band area represents the plus or minus confidence of the forecast) and the temperature data is in red. The second plot uses only man made effects. The third plot uses both man made and naturally occurring effects.
As you can see, the third result fits the observed data pretty well, much better than the other two. In this way, we can see the effect on the global average surface temperature from both the naturally occurring effects as well as the man made and the only way we can get reasonable results is if we include both. This the kind of thing models can help us to do.
And, we can see the model result is pretty good. Where are the contrarian claims about the model being a failure?
 |
| Source: IPCC Third Assessment Report |
Here is a plot of the temperature data plotted with the results of CMIP5 and CMIP3. You can see the models have a very nice correlation with the temperature data, especially CMIP5. Is the correlation perfect? Of course, not. There are some gaps and there is the very noticeable discrepancy near the end that contrarians love to point at with the claim that models have failed. As you can see, that claim is not valid. The models have, in fact, produced very good results.
So, how about that business at the end? It just means we have more to learn. Actually, continue down below and you will see that it is more a reflection of these models and these particular forecasts alone. Some models gave accurate forecasts for the period after the year 2000. In any event, it does not mean the models have failed.
So, how about that business at the end? It just means we have more to learn. Actually, continue down below and you will see that it is more a reflection of these models and these particular forecasts alone. Some models gave accurate forecasts for the period after the year 2000. In any event, it does not mean the models have failed.
 |
| Source: HotWhopper |
OK, how about some more common source of information. Let's begin with this one. It is a very nice summary of how the contrarians make false claims about the data. He reviews the claims concerning heating before and after 1950 and shows the contrarian claims are not valid. Then, he discusses the trends of the IPCC reports. What he finds is that when the data and the forecasts are plotted correctly, the observed data goes right down the middle of the model projections. It really is a nice piece of work and pretty conclusive.
This article here discusses a paper published in Nature Geoscience about a year and half ago. Unfortunately, the paper is not available for free online, but you can purchase it or go to the library to read it. It is a very good paper and the article does a good job of summarizing it. The paper examined model projections that started in the late 1990s and found that they gave a good projection of the global temperature after the year 2000. What is really interesting is that the warming went faster than the models predicted at first, not slower. But, again, we see the reality of the models does not reflect the claims of the contrarians.
Here is another paper, this one from the Union of Concerned Scientists. This one also states the models have been greatly improving, but we see the familiar statement again,
There remain some uncertainties with climate model performance, but that is to be expected from any system that aims to approximate conditions in the real world. Scientists are still trying to nail down cloud processes, aerosol distribution, ocean models, and sea ice changes. But model developers and climate physicists are addressing these issues by using large numbers of model simulations as well as a variety of statistical methods based on current and past observational data.Climate models are not easy and it is difficult to evaluate them fully. But, they are good and getting better.
Just to make sure I really beat this one to death (in my dreams, I know contrarians will be out there making the same claims), let me cite one more article. This one is from the American Meteorological Society. This paper is a little more complicated, but is a very nice piece of work. Unfortunately, it is from 2008 and does not include the most recent models, but that does not invalidate their evaluation. Perhaps they will repeat their work some day. And, their conclusion? Models are good and getting better.
So, when we actually look at model evaluations we find a) it is very difficult to properly evaluate model performance; 2) within that limitation, we find the models are actually doing pretty well; and 3) models are getting better and doing so at a pretty rapid pace.Current models are certainly not perfect, but we found that they are much more realistic than their predecessors. This is mostly related to the enormous progress in model development that took place over the last decade,
What is crucial in this is that every one of those points is contrary to the claims contrarians make about models. What is that? Why are they out there saying things about models that simply are not true? The reason is because they think they can get away with it.
Conclusion
So, what we have seen is that the claims by contrarians about models is not true. In fact, some of the claims being made are actually faked in order to produce the results desired by contrarians. The evidence shows that models are doing a good job and have been doing so for quite some time.
Yes, there are problems. But, keep in mind they are trying to model what may be the single most complicated system on the entire planet - the climate. Do you really think that it is going to go smoothly and easily? The thing I find amazing is that they are actually doing as well as they are. What we consistently see is the actual data is going right down the middle of the model projections.
And, that isn't bad at all.
Dear Keating,
ReplyDeleteYou explain to me that what ever is written on WUWT cannot be trusted, because of some issues you see with Anthony Watts.
So.. if its "something i read on Anthony Watts´ site i should not believe it..."
Now... this approach of yours obviously reveals that you did not notice THAT I WROTE THE ARTICLE ON WUWT like i did with 20-30 other articles on WUWT.
In general i cannot see in your answer that you have understood even remotely the point in my article, and you have not even noticed that I myself is the author.
Just because i place my article on WUWT does not mean that i no longer believe my own findings from original meteorological year books.
And honestly, If I where you i would remove comments from types like Mr Balter here, calling people with other viewpoints for "Cranks" and "deniers".
Unless of course that is the level of pro-IPCC commenters...
I did, in fact, notice that you wrote it. But, if you are affiliated with WUWT, then your credibility has gone to zero. WUWT receives funds from the Heartland Institute, an organization with the stated goal of undermining climate science. I will respond to your submission and, if I have issues with what you say, I will specify what they are. But, if you ever want to be taken seriously by anyone other than deniers I recommend you distance yourself as much as possible from WUWT. He has been proven, many times, to have posted and to have postings that are fraudulent and even outright lies. Do a little research on Watts and see what turns up. When you affiliate yourself with him you get painted by the same brush.
ReplyDeleteBut, as I said, your submission will judged on its merits.
As for removing Mr. Balter's comments about contrarians, why don't you object to the comments made by contrarians that are equally offensive? What you are saying is someone that insults contrarians is a bad person and should be censored, but contrarians can say anything they want. I have been subjected to some extremely offensive comments by contrarians. Why don't you object to those?
One of my goals is to allow people to see for themselves what is really going on and I would say you just added to it. Get your own community to behave before you start complaining about someone else.
Bad form.
I understood to topic perfectly, but apparently you don't understand the response. It is not at all unusual or controversial to find areas that are not warming, or even cooling, while the globe on average is getting warmer. The GISS graphic was to show that the average temperature is rising, but, even on a global scale, there are areas that have even cooled. This does not invalidate the fact that the average global temperature is going up.
ReplyDeleteWhat are the specifics involved with valleys not warming? I don't have that information. But, I know that it is not evidence that man made global warming is not real.
Dear Christopher.
ReplyDeleteYou write:
“My understanding is that you are claiming man made global warming is not real because some mountain valleys are not exhibiting as much warming as other regions. “
No, not “some” valleys. Valleys in general on all continents examined world wide. So far exceptions from this rule are so scarce that it does seem fair to talk about valleys in general.
You write:
“Well, you admitted the data for those areas are questionable. “
No I did not.
You write:
“The claim that a small area trumps what is happening in the rest of the world is not valid.”
No obviously not.
The observation in the links to articles you wont read is that in general specifically those areas where ocean air is avoided best possible show no or hardly any warming since the 1930-50 period. Not rarely even some valleys even temperature decline over the period.
Especially drier areas like the valleys should be vulnerable, sensitive to a world wide CO2 warming effect. If CO2 was driving warming, then especially these drier areas should show the fastest growing temperatures. But we see the opposite.
If you do not reflect the least about this finding especially for the valleys world wide, and just go ahead and ignore it – then how should I get the idea that you are here for a honest scientific purpose? No scientist would ignore such a piece of new input - even if you think i come from the wrong crowd.
(My first impression of you was VERY possitive, please prove that my first impression was in fact correct. If you come by Denmark i would still love to show you my material first hand. )
K.R. Frank
I simply asked for a polite tone, and i do that just as often with sceptics as I do with pro-IPCC commenters.
ReplyDeleteI cant do magic and make all sceptics behave.. believe me i have tried.
This guy "Batter" has no arguments, just name.calling. Honestly, you should not accept people going that low - even when they are from your side in the debate, thats irrelevant.
K.R. Frank
Using the 1930-1950 period is cherry picking and is a false argument. The effects of anthropogenic warming didn't become significantly larger than naturally occurring drivers until the late 1970s. Compare the areas you specified with the temperature records of 1980.
ReplyDeleteAnd, just as you jumped to an unjustified conclusion on the data, you jumped to an unjustified conclusion about what I have, and have not, read. Yes, I did read the articles you provided links to. And, no, I did not just ignore your claims. Stop jumping to conclusions that are not justified and are not supported by the evidence.
I am sorry you feel you are still in the right. A given area of cooling, or not warming, does not negate an entire planet of warming. Like I said, go back and compare today's temperatures with the temperatures of 1980. I would find that comparison much more relevant and more scientifically valid.
I would have to reject at least half of all contrarians if I started doing that. I have asked him to tone it down. Tell me, when was the last time you complained about the comments made by contrarians? Or, is it only the scientifically correct people you object to?
ReplyDeleteHonestly, Chrisotpher i have MASSIVE fight with sceptics than cant figure out how to behave polite too (!) I think this is a general issue for both sides in the debate.
ReplyDeleterecently i actually complained to Watts himself about a sceptic guy being rude and aggresive, oh yes, i do that too. bad manners can kille any interesting debate.
In specifically your blog: Im sorry i have not read so much of all this. Thats why you dont see my comments around, sorry!
But thanks a lot, it is appreciated what you did.
K,R. Frank
You write: "A given area of cooling, or not warming, does not negate an entire planet of warming"
ReplyDeleteTRUE TRUE TRUE :-)
- but if Valleys systematiccaly world wide is not warmed by CO2, then THE REASON for the warming is indeed challenged. Count to 10 and think about this please.
IF CO2 was a strong driver of temperature, obviously areas not disturbed by ocean trends etc. (the valleys in good shelter og ocean air) MUST show warming as general normal typical feature. But they just dont. They just dont.
I have spent years digging into this, traveled to universities for original data etcetcetc. Its solid.
Unless you have an exmplanation. You can call a friend for backup.. :-)
The period 1930-50 / "Cherry picking".
Well, this period is the period that data tells is as warm as today in these areas of ocean shelter.
http://hidethedecline.eu/media/AORIT/SUM/16.gif
Should we then ignore that CO2 cannot heat the Earth more than the 1930-50 period today? (Unless helped by ocean air trends) And just look at some other period? Are you serious?
As you say, the CO2 boom was AFTER the 1930-50 period, and this is exactly why this period is so interesting. If CO2 "worked" as supposed, it shold have created a heat balance over the Earth much warmer today than also the 1930-50 period. But in areas with little noise from oceans, the valleys, we can see that the heat balance over the Earth today is NOT the different than 1930-50 as i should be. Had CO2 "worked" on this planet as expected.
K.R. Frank
Thank you for that. I try my best (although I admit I sometimes fail) to be as civil as I can to anyone that is civil to me first. I have even stopped calling individual deniers because I was told it would be more civil. I am using the term 'contrarian' instead.
ReplyDeleteI would greatly prefer to see nothing but civil discussions here. But, I let the uncivil comments stand so that people can see for themselves what is going on. It is a poorly-held secret that a strategy by the professional denier organizations is to bully and intimidate scientists so they will vacate the public state. Scientists have even been physically attacked and received death threats. The sad thing is that this strategy is working. Many scientists just refuse to get into the public debate because they don't feel being bullied is part of their job.
So, this is something we can be in full agreement on.
But, you never showed that valleys are not being warmed by CO2. It is entirely possible they are being warmed by CO2 but cooled by something else. In fact, if this cooling is actually taking place I would expect that this is exactly what is happening. (I still have serious issues with you comparing today's data to pre0-1950 data and question if this cooling is actually taking place as you have stated.)
ReplyDeleteWhat you have stated is the temperature data is cooler in the valleys, therefore they are not being warmed by CO2 and you did not provide any evidence at all that this is the case. Why did you reject the idea that something else may be involved leading to cooling? This is a failure under the scientific method.
So we agree that especially valleys with little noise and delay in trends from incoming ocean air trends should be the areas on this planet showing the fastest warming? With little disturbing, the strong CO2 warming effect should triumph in these areas, right?
ReplyDeleteI think so, but since we don’t see this you then add:
“It is entirely possible they are being warmed by CO2 but cooled by something else.”
Ok, you suggest some kind of strong cooling agent in the atmosphere – so strong it can match the supposed strong warming effect of CO2 (and CH4 etc).
And since we generally see warming on Earth, this cooling substance should pretty much work only in valleys – because otherwise the planet as a whole should be cooled down.
You suggest: “Strong valley cooling in recent decade” but suggest no ideas or mechanisms to make your idea possible or plausible.
At some point sulfuric aerosols was suggested as a cooling ingredient generally, but since this substance is mostly present near larger populations, and its not at all supposed to work especially well in some times remote mountain valleys around the world, it seems not to be a real possibility.
Any other ideas?
Even large valleys like the entire country of Hungary show hardly any warming outside urban Budapest. CO2 is present over Hungary too, but the heat balance is not warmer there today than 1930-50, before the increase of CO2. A “test area” like Hungary is the real world, the real atmosphere, the real deal.
YES, there could be “something” with a very strong opposite effect of CO2. And I agree, a true scientist should try to think about any such possibility.
But if the real world show systematically missing heating in areas where CO2 especially should have created it, this is a real problem. Its not enough that you have an idea that perhaps “something” may have an opposite effect.
UNTIL anyone can come up with even just the slightest idea of what “something” should cause a strong cooling especially in mountain valleys in recent decades, then it is just a thought.
***
If any loose thought about any theory should be counted in equally, then no theories about anything in the entire world would stand.
***
(And that goes for the CO2 theory too, im sure that many people have unsupported thoughts about this too… im sure you wont count such loose thoughts in either )
K.R. Frank
Do not put words in my mouth, Frank. I most definitely did not agree to that. In fact, I clearly questioned your data because you compared modern temperatures to pre-1950 values instead of a more modern baseline.
ReplyDeleteAnd, I did not suggest any kind of cooling agent. I just pointed out you did not consider alternative explanations before jumping to the conclusion you wanted. Why is it not possible for winds to come off mountain peaks and clear out warming air as they go through the valleys? This is just one simple alternative and I am sure there are lots of others. What have you done to eliminate all of these possible alternatives?
Again, I am not even convinced your data is correct since it was done incorrectly. Redo the data with correct methodology and then we can worry about what alternatives need to be examined.
1) You write: " I am not even convinced your data is correct since it was done incorrectly"
ReplyDelete2) And you maintain – like may pro-IPCC debators – that we should not look at data from the last warm period just 70 years ago – only compare todays temperature with the colder period 1960-80?
Shutting out the warm 1930-50 period is a very normal approach when arguing for global warming.
Example, SWEDEN:
http://hidethedecline.eu/media/AORIT/Sweden/8a.gif
http://hidethedecline.eu/media/AORIT/Sweden/8b.gif
The red data points on these figures are online available for the people, the blue data points I had to look up myself in the Swedish university of Lund in original meteorological year books and it’s the first time they are online ever as is the case for almost all countries I work with.
So here we have a large chunk of data agreeing that most of the huge Swedish area is rather well sheltered against ocean air from west was approx. as warm 1930-50 as today.
1) How can you argue that these data for example "are done incorrectly"?
2) How can you argue that the previous warm period 1930-50 is not well supported by date and thus must be ruled out when evaulating global warming?
Then you for some reason think that I have worked with this for years without reflecting about the possibilities. Not true obviously, and the “simple” suggestion you have that air can cool over the mountains makes no sence for several reasons.
First : Howcome such an effect should yield colder and colder air to the valleys over the years to compensate the strong CO2 warming you insist is in the valleys? Second: Mountains experiences warming, so air from those locations is not the obvious an explanation as you might think. So “simple”, yes, “correct, no.
Please answer 1) and 2)
K.R. Frank
This is what is known as cherry picking. As contrarians frequently state, the climate changes through natural cycles. What we are interested in studying, in our particular case, is the effects of man made emissions on the climate. Those emissions did not start to climb to significant levels and start accumulating in the atmosphere until recent decades. I am not stating that the previous periods (warm or cool) are not supported by data, I am saying they are naturally varying periods that occurred before man made effects became significant. If you are going to compare the effects of man made emissions to today, why stop with the 1930 - 1950 period? You could pick any period using your logic, so you picked a period that made your argument. That is why it is cherry picking and is why it is irrelevant. If you want to know what effect man made emissions have on the climate then you need to compare the period where our emissions are a significant factor to a relevant baseline. The question is, are you interested in science or are you just interested in a specific conclusion?
ReplyDeleteDid you really look at that first plot and say CO2 levels "just rose" after 1950?
ReplyDeleteOK, this is my final response to you, Frank. I'm sorry you can't understand the science, but I have tried my best to explain it to you.
If you want to compare the data, you have to have a reasonable baseline that will allow you to see what, if any, changes may have occurred during the observation period. You cherry picked a baseline that prohibited that.
Your data is flawed and your logic is flawed. As a result, your conclusion is flawed. If you can't accept, or don't want to accept, the scientific reasons I make the statements I have, then you are just out of luck.
Let's summarize what you said. You found that you can take one small area of the planet, cherry pick data to compare it to, refuse to consider any alternative explanations for what you find and then insist that it is proof man made global warming isn't real.
If you are OK with all of that, then there is nothing I can do for you.
We are done.
You simply do not understand even the very basics of this topic and you just bring one big stream of tedious repeated unsupported claims.
ReplyDeleteAt the same time you imagine you are in a position to talk descending.
Wow.
You insist that making a compare between present warm period with other warm periods (For ex 1930-50) is "cherry picking".
ReplyDeleteThis way you can always claim that CO2 has created decades of unusual heat.
Its not science. Its just plain wrong.
You know, Frank. You are obsessed with being wrong and finding a way to justify it. It is time for you to move on. I am not going to spend any more time on you.
ReplyDeleteIm WRONG??????????
ReplyDeleteIts YOU who wrongly claim that human CO2 emmisions did not explode after 1950:
http://www.biospherecapital.com/images/co2-global.jpg
WRONG
Its you that claim that it is not allowed to compare recent heat with other warm periods (like 1930-50). You dismis this as "Cherry picking" an so no one are allowed to show that the recent heat is not unique. WRONG
It is you that claims out of the blue that "my data are flawed" .
http://hidethedecline.eu/media...
http://hidethedecline.eu/media...
I then gave you the data from Sweden so you could tell me whats "flawed" about them you just repeat that my data is "flawed".
WRONG
It is you tha claim that air going over mountain ridges (that have been warming) should somehow explain that the valleys are not warming...
WRONG
etcetc
And then you salute saying that I am obsessed with being wrong??
WRONG
What a show of empty claims, buhhhh!
And I have to add your repeated attemps to twist the whole argument i bring:
ReplyDeleteMy argument is that "VALLEY" areas accros the planet where ocean air trends dont disturb things show little or no warming after the warm period 1930-50 where CO2 concentrations where 310 ppm.
You repeatedly twist this into an argument that "SOME" areas around the world is not warming, which if ofcourse a null-argument proving nothing.
If you had good arguments, you would not need to twist my éssential argument.
WRONG??
ReplyDeleteIts YOU who wrongly claim that human CO2 emmisions did not explode after 1950:
http://www.biospherecapital.com/images/co2-global.jpg WRONG
Its you that claim that it is not allowed to compare recent heat with other warm periods (like 1930-50). You dismis this as "Cherry picking" an so no one are allowed to show that the recent heat is not unique. WRONG
It is you that claims out of the blue that "my data are flawed" .
http://hidethedecline.eu/media/AORIT/Sweden/8a.gif
http://hidethedecline.eu/media/AORIT/Sweden/8b.gif
I then gave you the data from Sweden so you could tell me whats "flawed" about them you just repeat that my data is "flawed".
WRONG
It is you tha claim that air going over mountain ridges (that have been warming) should somehow explain that the valleys are not warming...
WRONG
etcetc.
And then you salute saying that I am obsessed with being wrong??
WRONG
What a show of empty faulty claims.
Comment restored, had "dissapeared"...
ReplyDelete